Benchmarks
We've run benchmarks to quantify OrbStack's performance and power efficiency. Results and methodology are below and on the website.
We use real-world developer workloads in order to show a better picture of how OrbStack performs in practice. However, results are highly dependent on workload, so your particular use case may or may not show improvements.
Testing conducted in late August 2023 with the latest versions of OrbStack (v0.17.0) and Docker Desktop (v4.22.0) at the time. Unless otherwise noted, all settings were left at their respective defaults, and all tests were run on an M1 Max MacBook Pro.
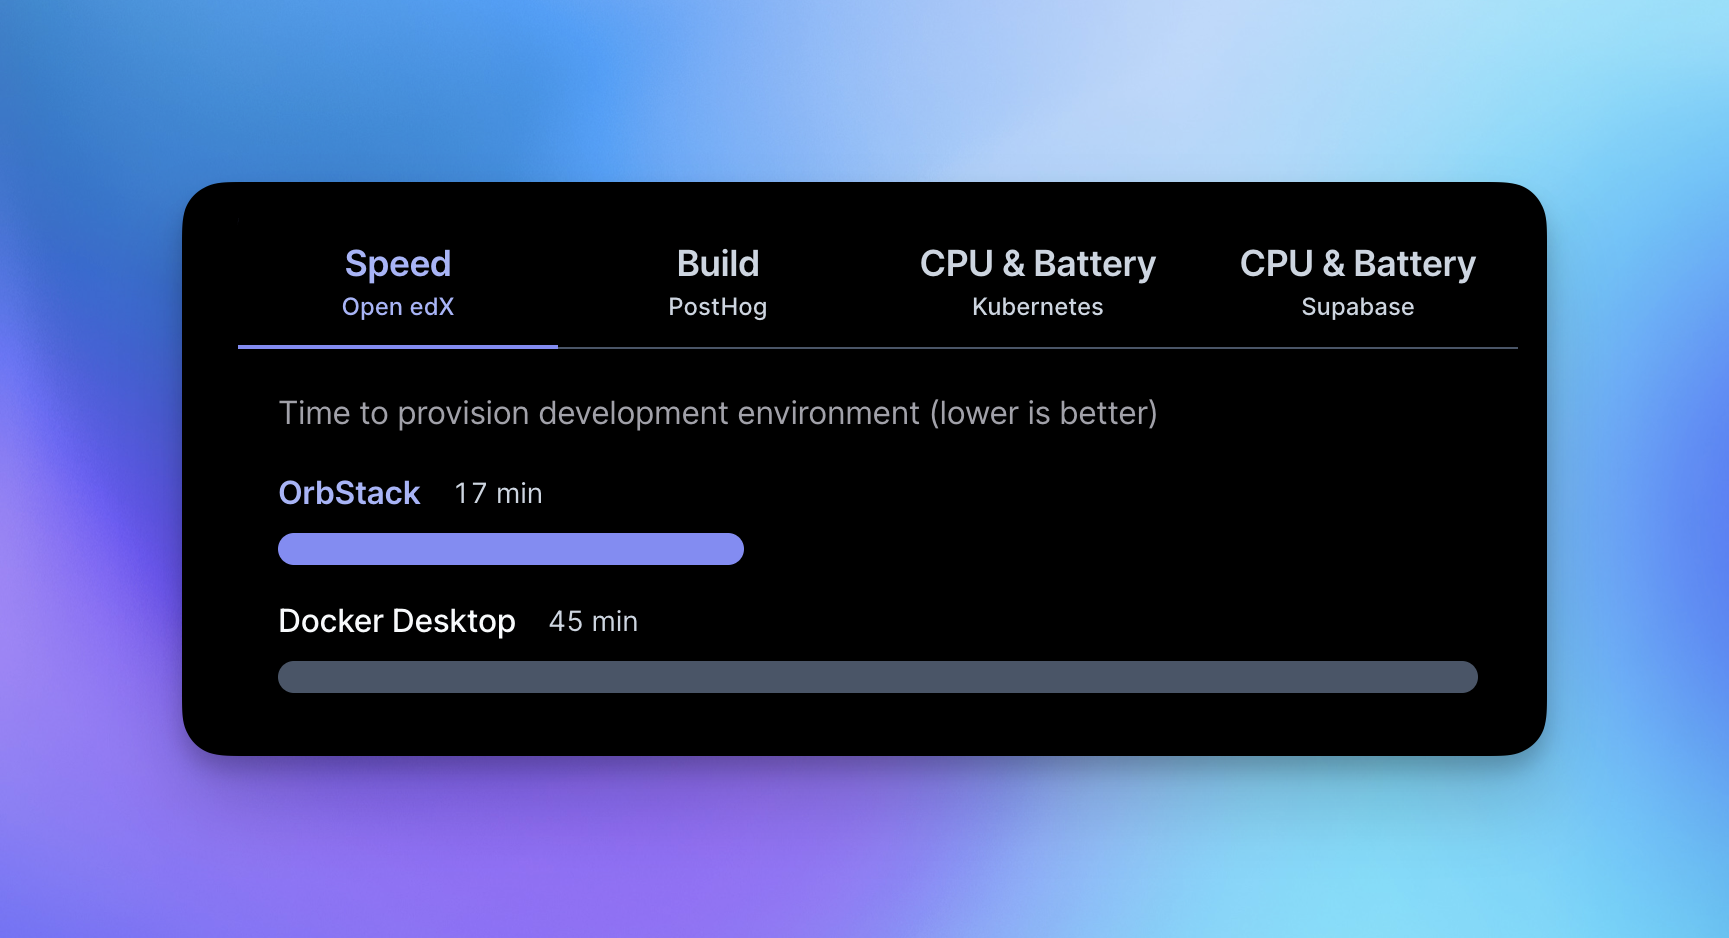
Heavy build: Open edX
Methodology
This benchmark installs, builds, and configures a heavy set of services (devstack, commit 48096774) for local Open edX development. This is a complex application stack that involves JavaScript, Python, Ruby, MySQL, MongoDB, Redis, Elasticsearch, and more.
# Exclude image pull time to reduce network noise
make pull
time make dev.provision
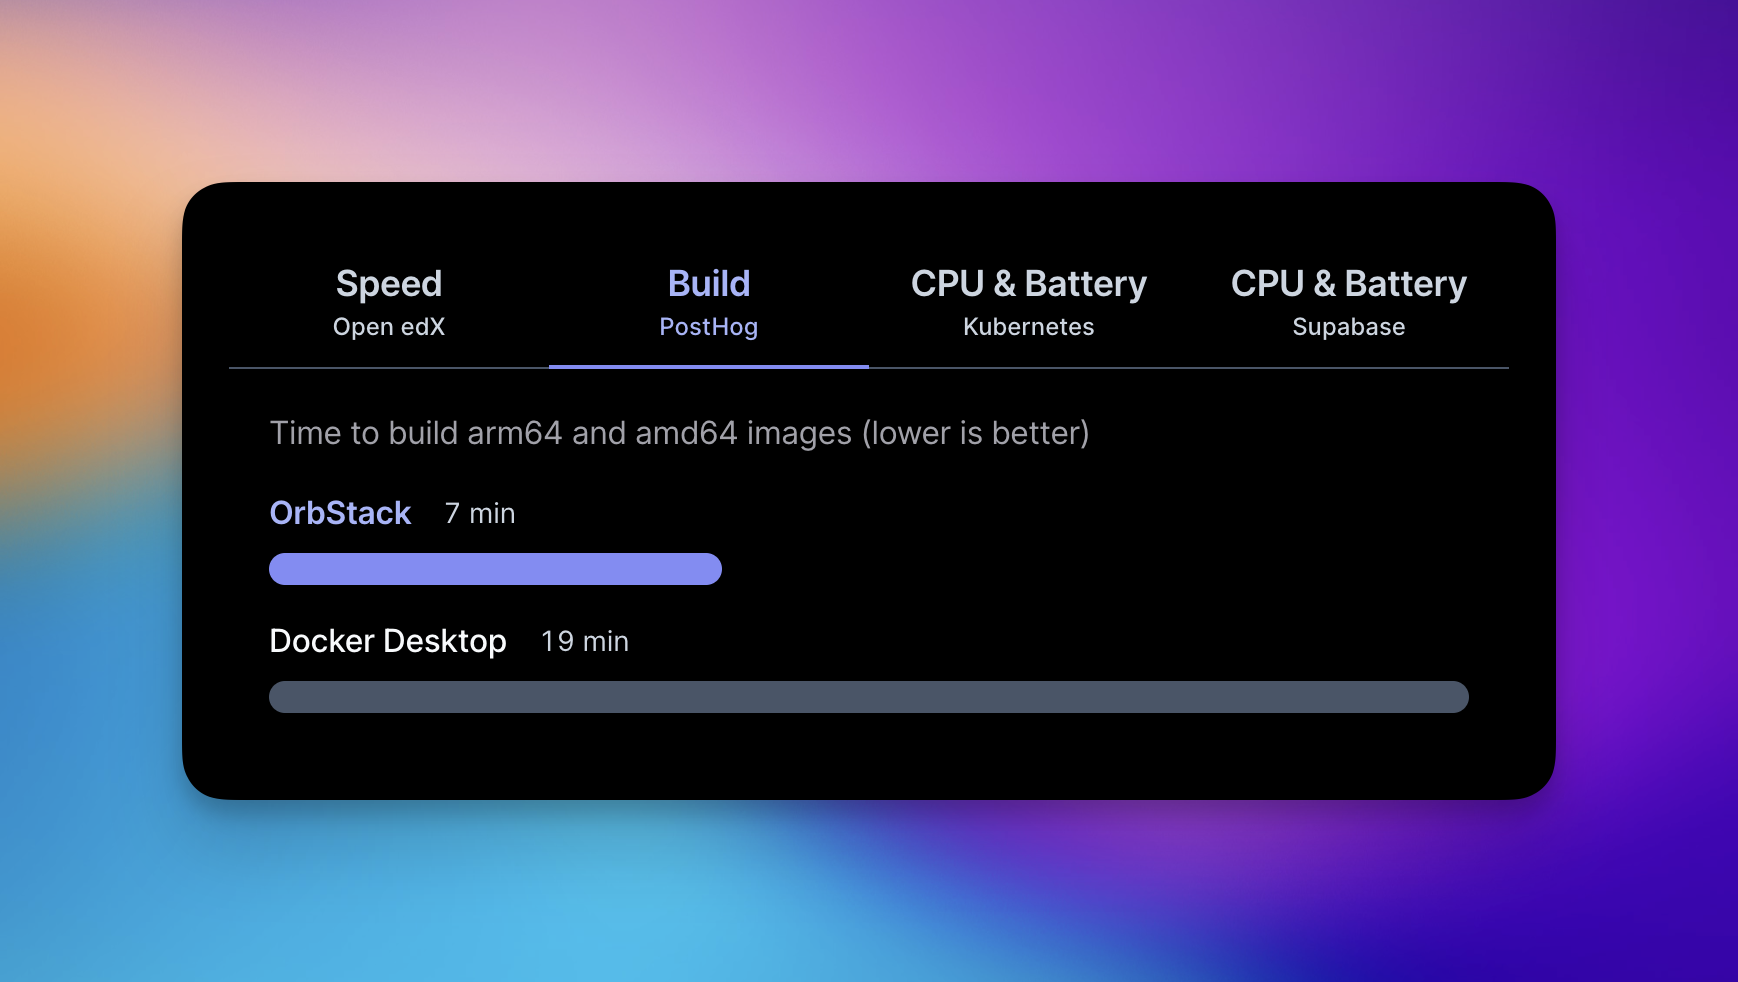
Heavy build: PostHog
Methodology
This benchmarks builds PostHog's Docker image (commit 42f4d6bb) for both linux/arm64 and linux/amd64. The two builds are done in serial because BuildKit's docker driver doesn't support multi-platform image builds.
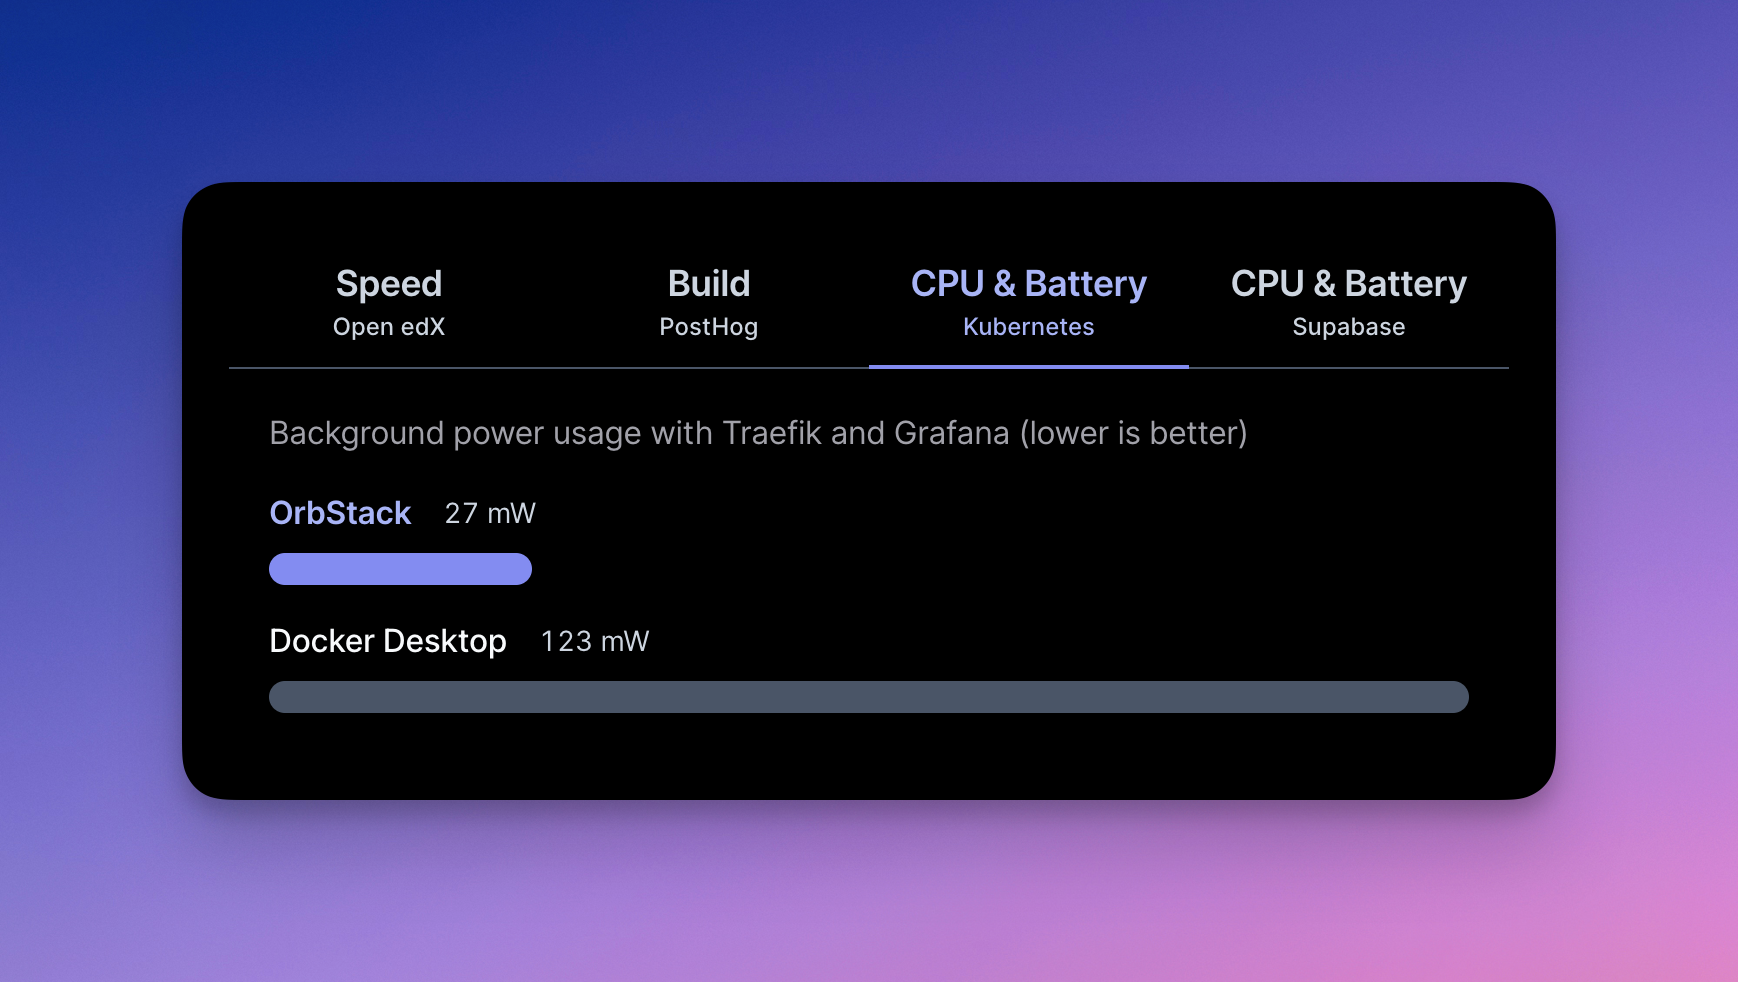
Battery: Kubernetes
Methodology
We created a fresh Kubernetes cluster in each app, then used Helm to install Traefik and Grafana:
helm repo add traefik https://traefik.github.io/charts
helm repo add grafana https://grafana.github.io/helm-charts
helm repo update
helm install traefik traefik/traefik
helm install grafana grafana/grafana
After waiting for CPU usage to settle, we measured the long-term average power usage over 10 minutes by sampling the process group's estimated energy usage (in nJ) from the macOS kernel before and after the test, and converting it to power usage (in mW) using the elapsed time.
This is an underestimate of the true system-wide power usage as it does not account for the macOS kernel and other sources of power usage. However, we believe it is the best metric for this comparison as it avoids interference from system noise but includes all contributions from the app's processes (including the GUI), and it has empirically proven to be a good predictor of relative differences in energy usage.
You can get very similar numbers by checking the "Energy Impact" column in Activity Monitor.
Since using energy produces heat, which can cause fans to spin up and induce thermal throttling, this tends to be a better predictor of UX than CPU usage (especially on heterogeneous systems like M1).
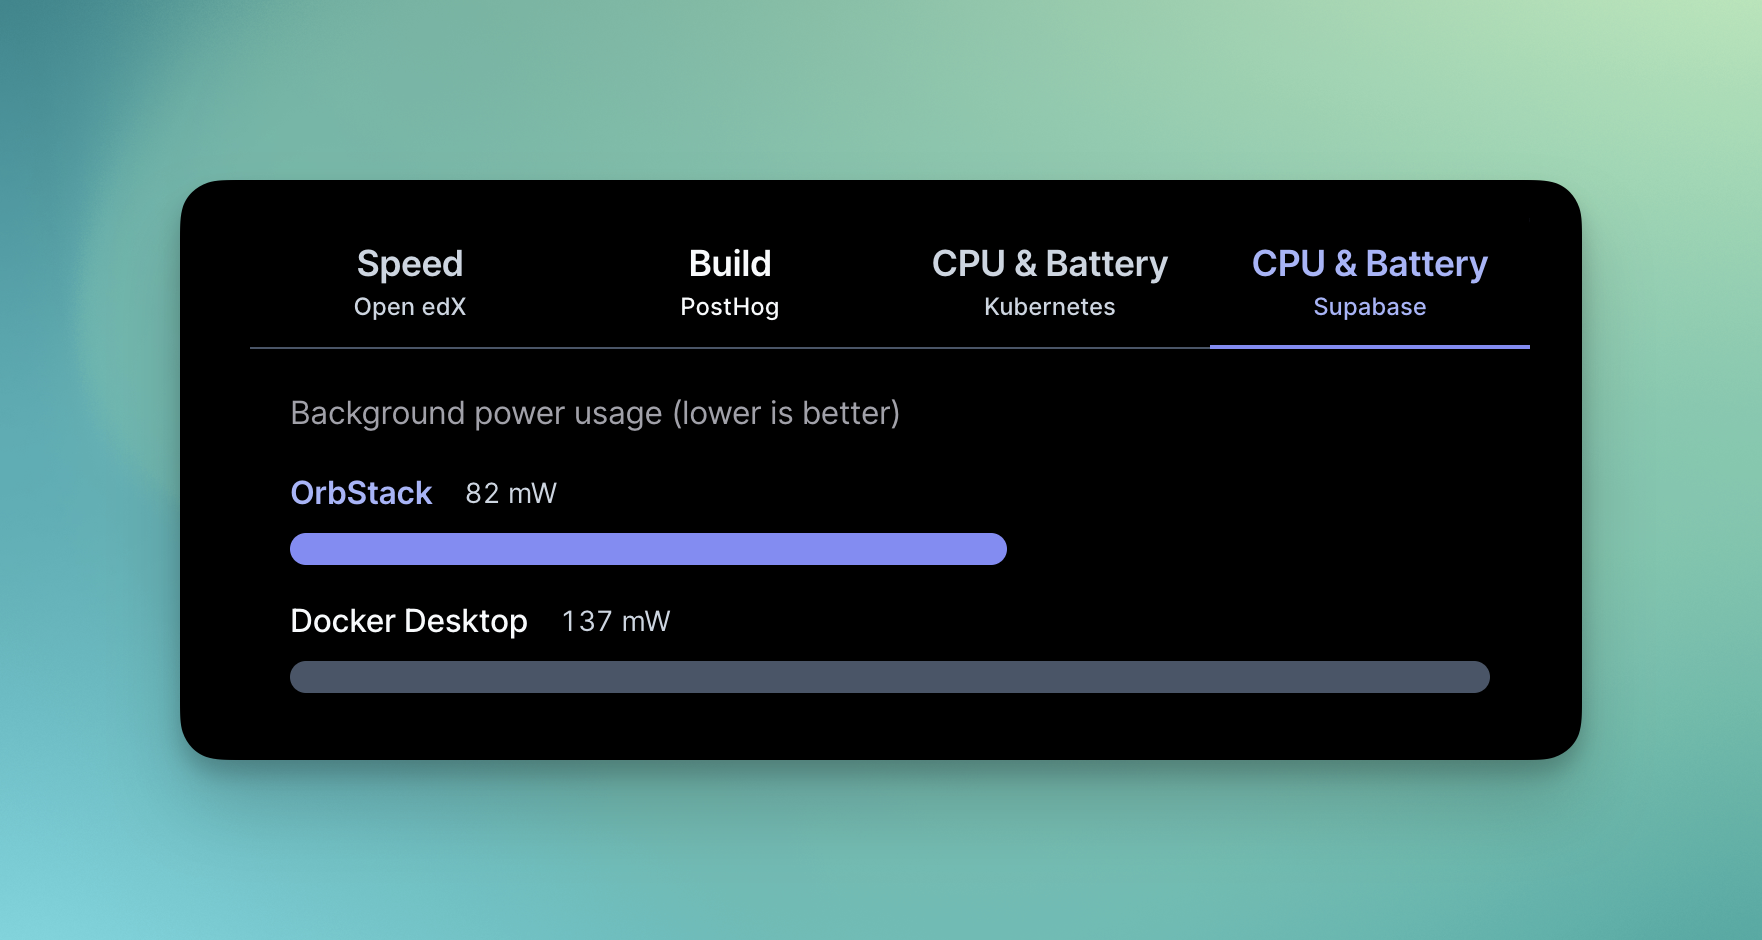
Battery: Supabase
Methodology
We used Docker Compose to run a self-hosted Supabase stack (commit e3987f4d) in each app—a setup commonly used for local development.
Power usage was then sampled with the same method as Kubernetes.
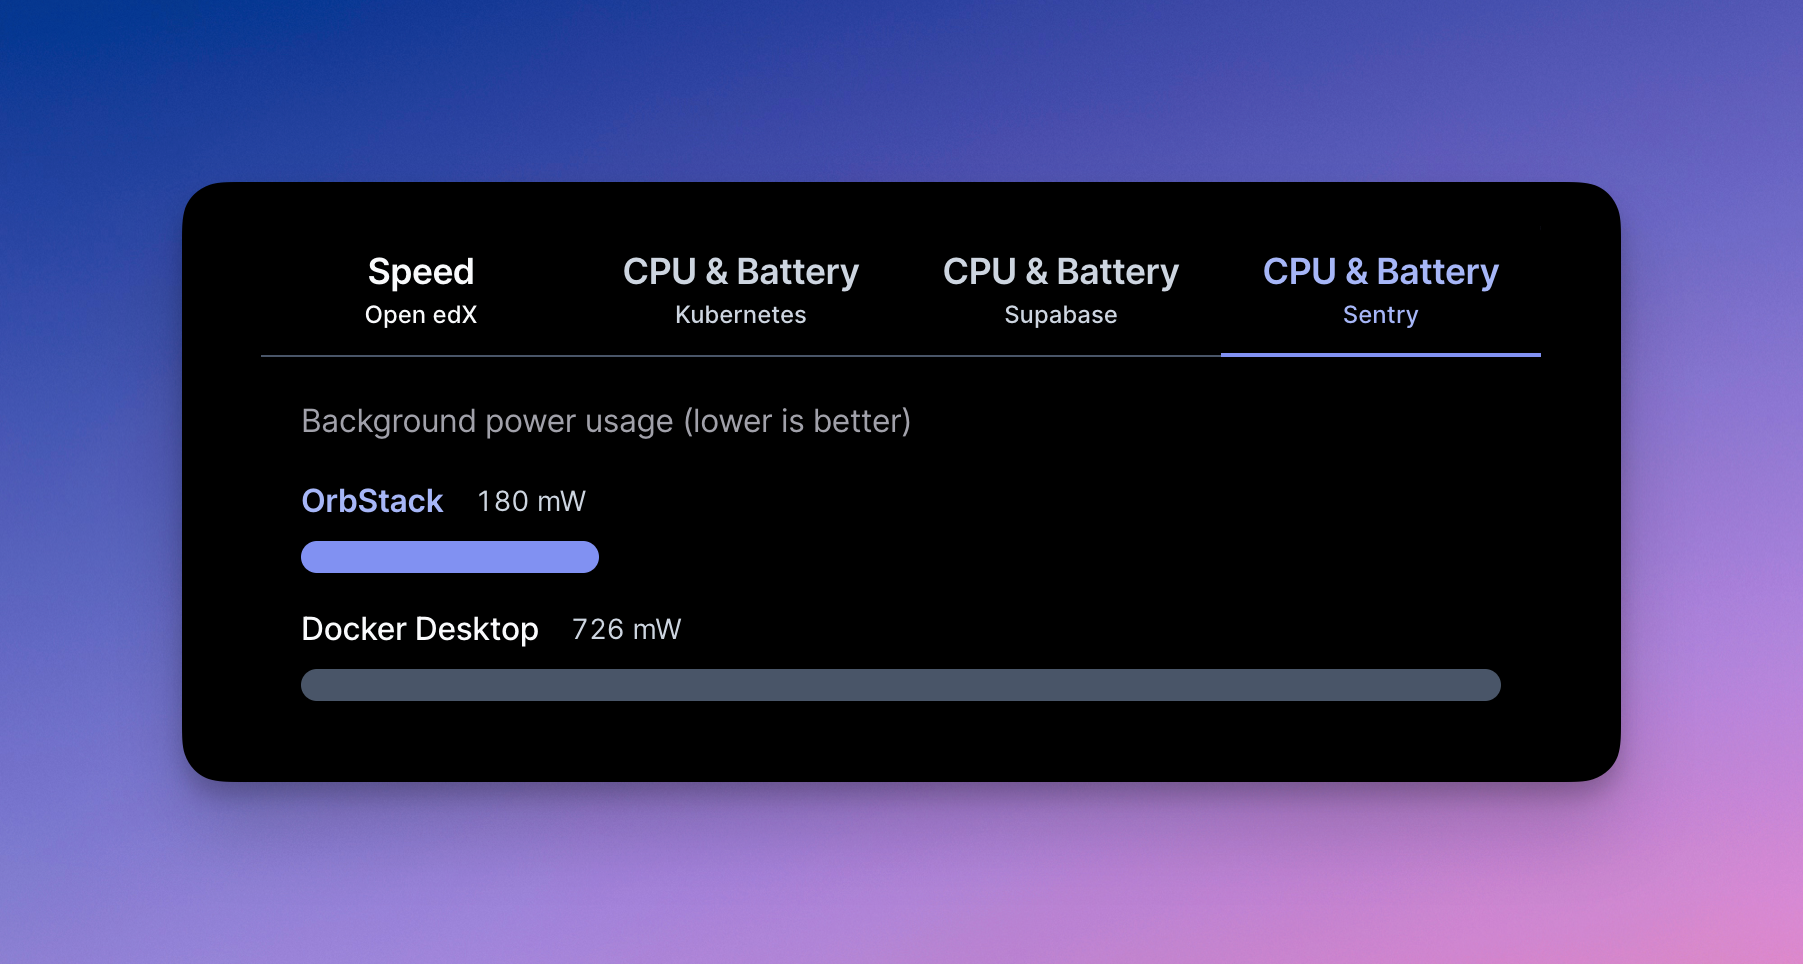
Battery: Sentry
Methodology
We used Docker Compose to run a self-hosted Sentry instance (commit 15fa261f) in each app. This is a very complex application with 38 services.
Power usage was then sampled with the same method as Kubernetes.
